Userflow offers two distinct alert types to monitor Flow performance: custom alert policies you configure yourself, and Signals powered by FlowAI, which proactively surface significant changes without the manual setup.
Custom alert policies: Threshold-based alerts you configure for Flows, Checklists, and Launchers (for example, when views or completion rates fall below a defined limit).
Signals: Automatic AI-driven insights that detect meaningful performance changes in Flows and highlight exactly where users are dropping off or encountering issues, with no manual setup required.
Are alerts included in my Userflow plan?
Alerting availability depends on your plan — check your billing settings to see what's included.
Custom alert policies
Custom alert policies let you define explicit thresholds for when Userflow should alert you about performance issues in Flows, Checklists, and Launchers. These alerts help identify potential issues with auto-start conditions, targeting rules, or flow performance, enabling quick intervention before user experience is impacted.
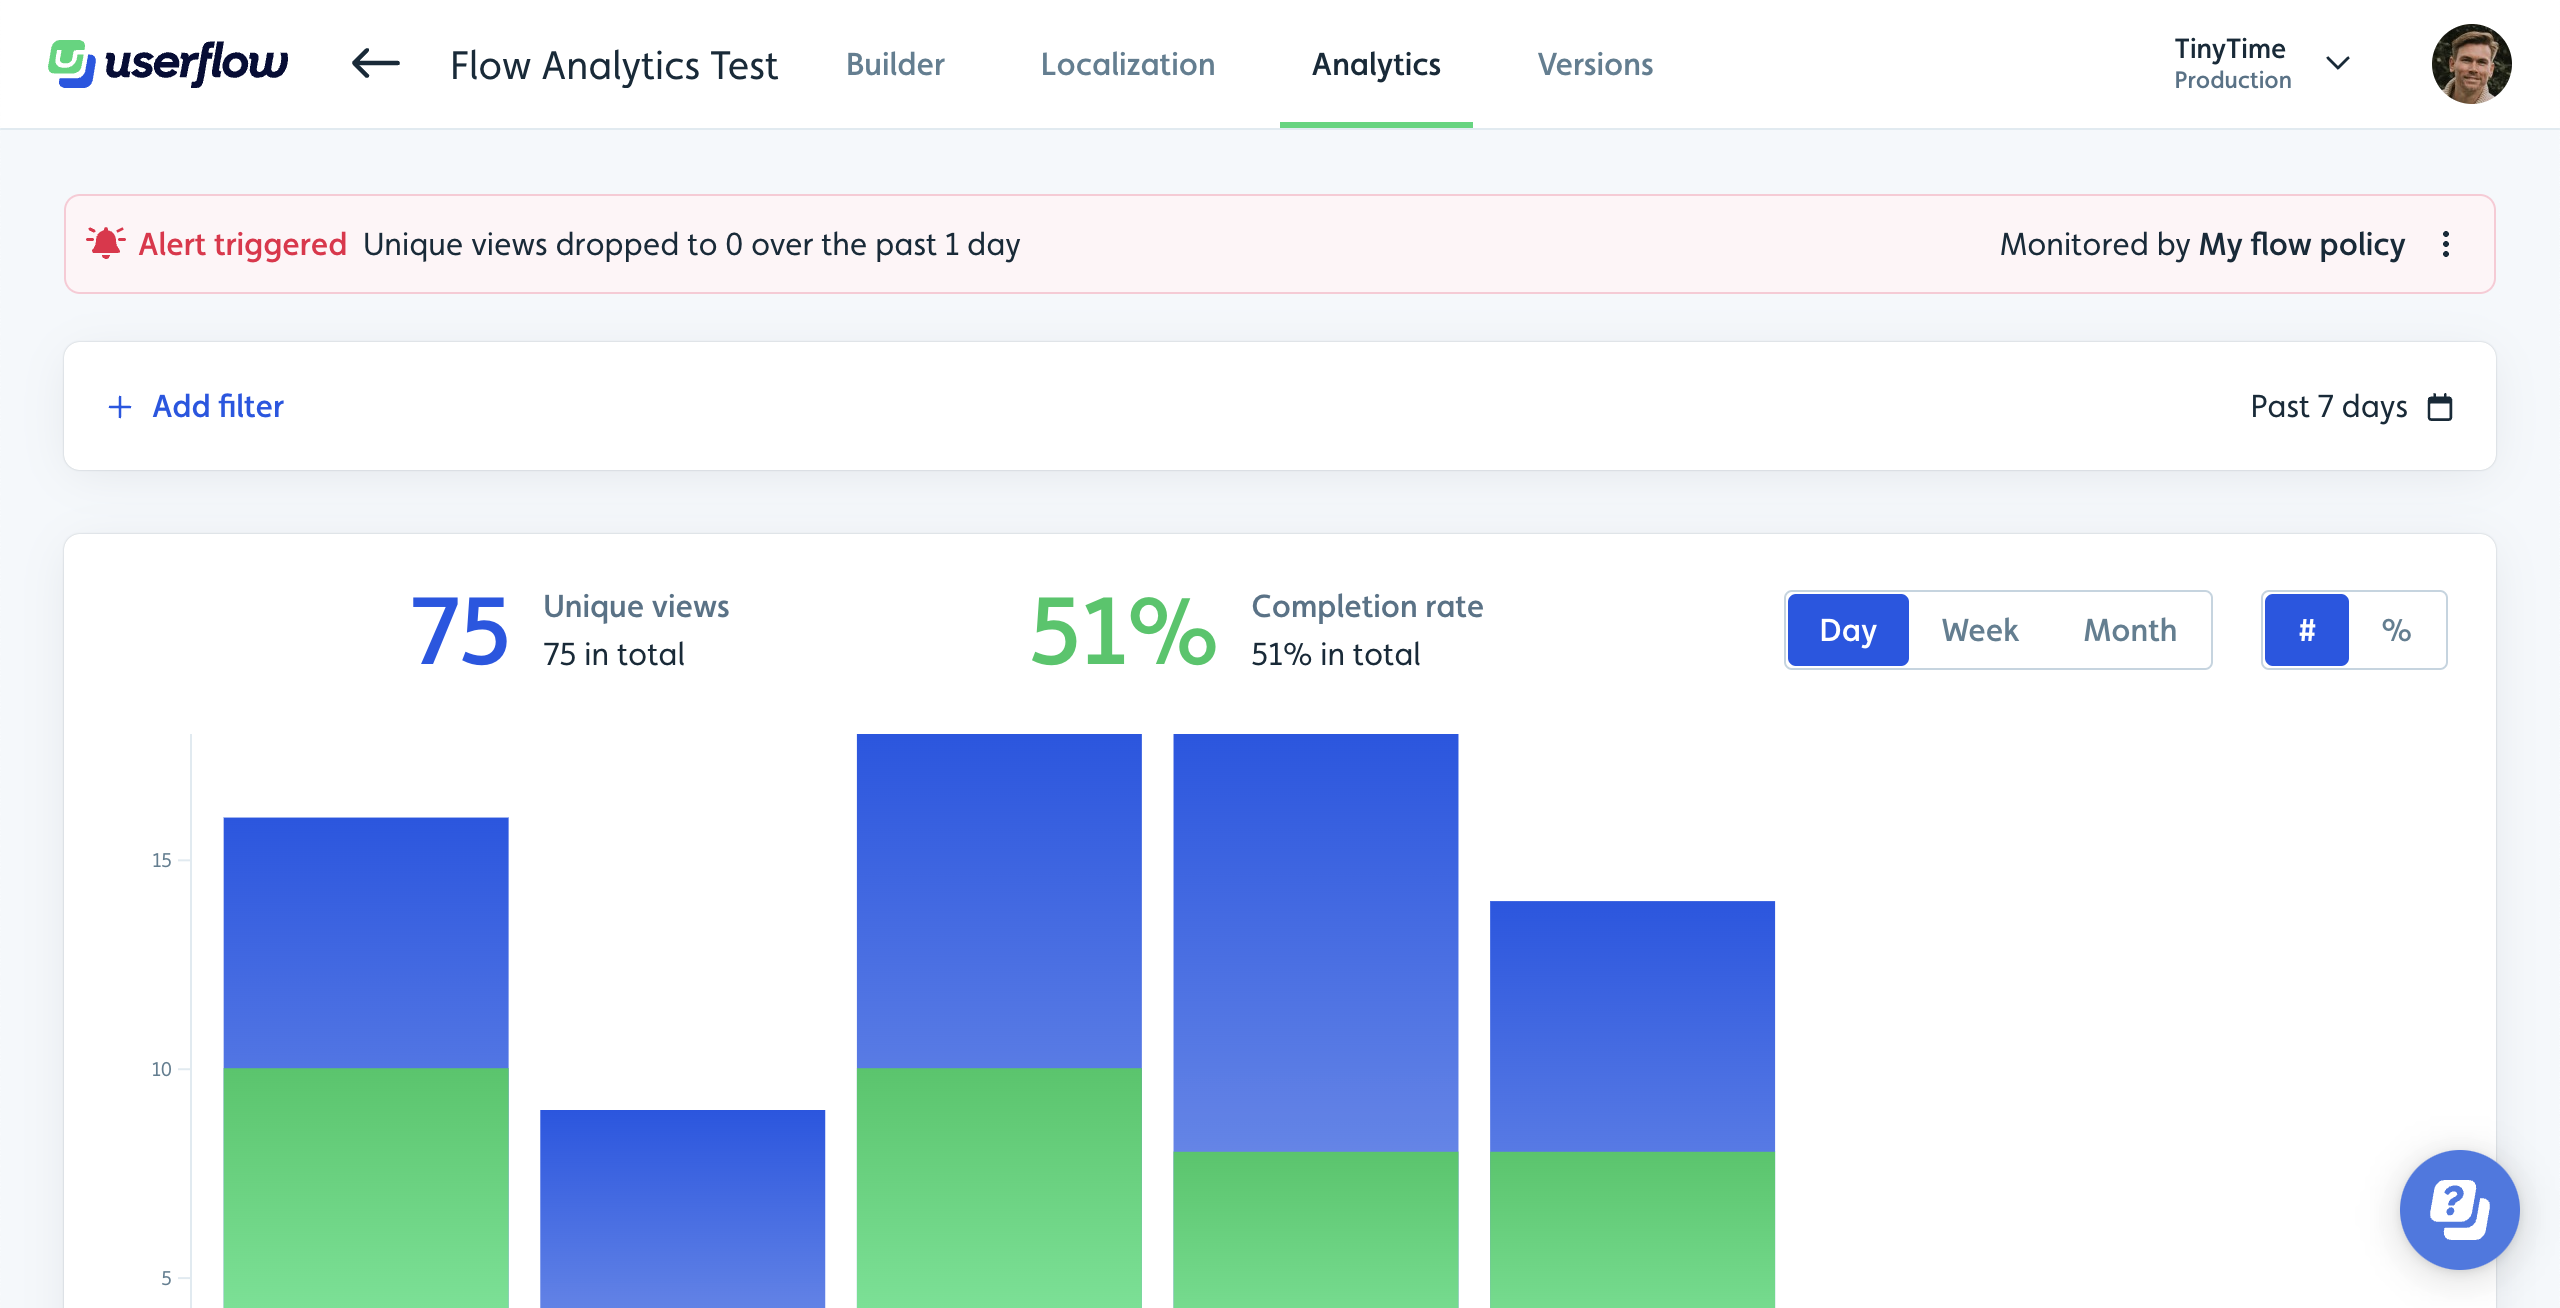
You configure alerts for metrics such as Unique views, Completion rate, Activation rate, and missing Tooltip target rate over a chosen timeframe.
Create and manage policies in Settings > Alerting, which can be assigned to multiple content items and trigger email and in-app alerts when conditions are met.
FlowAI Signals
Signals automatically monitors your Flows and surfaces high-impact performance changes as insight “cards” above the Flow analytics dashboard.
FlowAI analyzes views, completion volume, step-level drop-offs, and element errors over time (week-over-week, month-over-month, quarter-over-quarter) and only shows the most significant, high-impact movement and issues.
You can receive email notifications by clicking Subscribe on the Flow’s Analytics tab, and each insight links directly to the affected step or metric so you can act quickly.
Custom alerts vs. Signals
|
Aspect |
Custom alert policies |
AI Signals |
|---|---|---|
|
Setup |
Manually configured thresholds per Flow, Checklist, or Launcher in Settings > Alerting. |
No setup required; automatically enabled for eligible Flows. |
|
Coverage |
Views, completion rate, activation rate, and missing tooltip target rate. |
View changes, completion volume changes, step views analysis, and element errors. |
|
Scope |
Flows, Checklists, and Launchers. |
Flows only. |
|
Trigger logic |
Alert fires when your defined metric drops below the threshold within the specified timeframe. |
Insight appears when the AI detects statistically significant, high-impact changes (e.g., sudden drops >50% or to zero). |
|
Noise level |
You control sensitivity via thresholds; this may require tuning. |
Prioritized to show a maximum of three negative and one positive insight per Flow, focusing on high-impact issues. |
|
Email notifications |
Configured on each policy with specific recipients. |
Enabled per Flow via Subscribe on the Analytics tab. |
Set up the business region for Signals
Configure your business region so Signals can account for natural fluctuations in activity, such as weekends and holidays. This will prevent false alerts for expected trends.
Select Settings > Alerting from the sidebar.
Select your business region from the dropdown.
.png)
Configure custom alerts
Select Settings > Alerting from the sidebar.
.png)
Click the New button corresponding to the alert type you want to create – a Flow, Checklist, or Launcher policy.
Enter a policy name.
.png)
Use the toggle switch to activate one or more metrics to monitor, then enter the number or percentage threshold and duration for each. For example, 25 unique views over 4 days or a 50% drop over 5 days.
Unique views (All policy types)
Completion rate (Flows & Checklists)
Missing tooltip target rate (Flows)
Activation rate (Launchers)
By default, the Notify by email toggle switch will be activated with the checkbox selected for the user creating the alert. Add email addresses for (up to eight) additional recipients in the spaces provided.
Regardless of whether email alerts are active for a policy, alerts will appear at the top of the flow.
.png)
Use the toggle switch to activate monitoring for the desired environments.
To designate the new policy as a default for all future Flows, Checklists, or Launchers, select the checkbox to make it the default policy.
Click Create alert policy.
If Flows, Checklists, or Launchers already exist, you will be prompted to select which flows this policy should be assigned to.
.png)
Here you can:
- Select all
- Select all with no policy
- Deselect all
- Select individual itemsClick Save assignments.
Manage alert assignments or edit/delete a policy
After creating an alert policy, you can manage the Flows, Checklists, or Launchers it is assigned to, or edit or delete a policy. From the Alerting settings, click the options menu next to a policy and select the desired option. Complete the prompts that follow..png)
Alert checking, triggering, and resolving
Every 6 hours, we evaluate all content items against their respective alert policies.
An alert is triggered if all of the following is true:
The content item is assigned to an alert policy.
The policy is monitoring the environment.
The content item is published in the environment.
Alerts are not muted for the content item.
Any monitored metric falls below the defined threshold.
The content item has been published for a duration equal to or longer than the chosen metric’s timeframe. Example: If a policy monitors “over 3 days”, it does not make sense to trigger an alert until the content item has been published for at least 3 days.
Triggered alerts result in immediate email notifications:
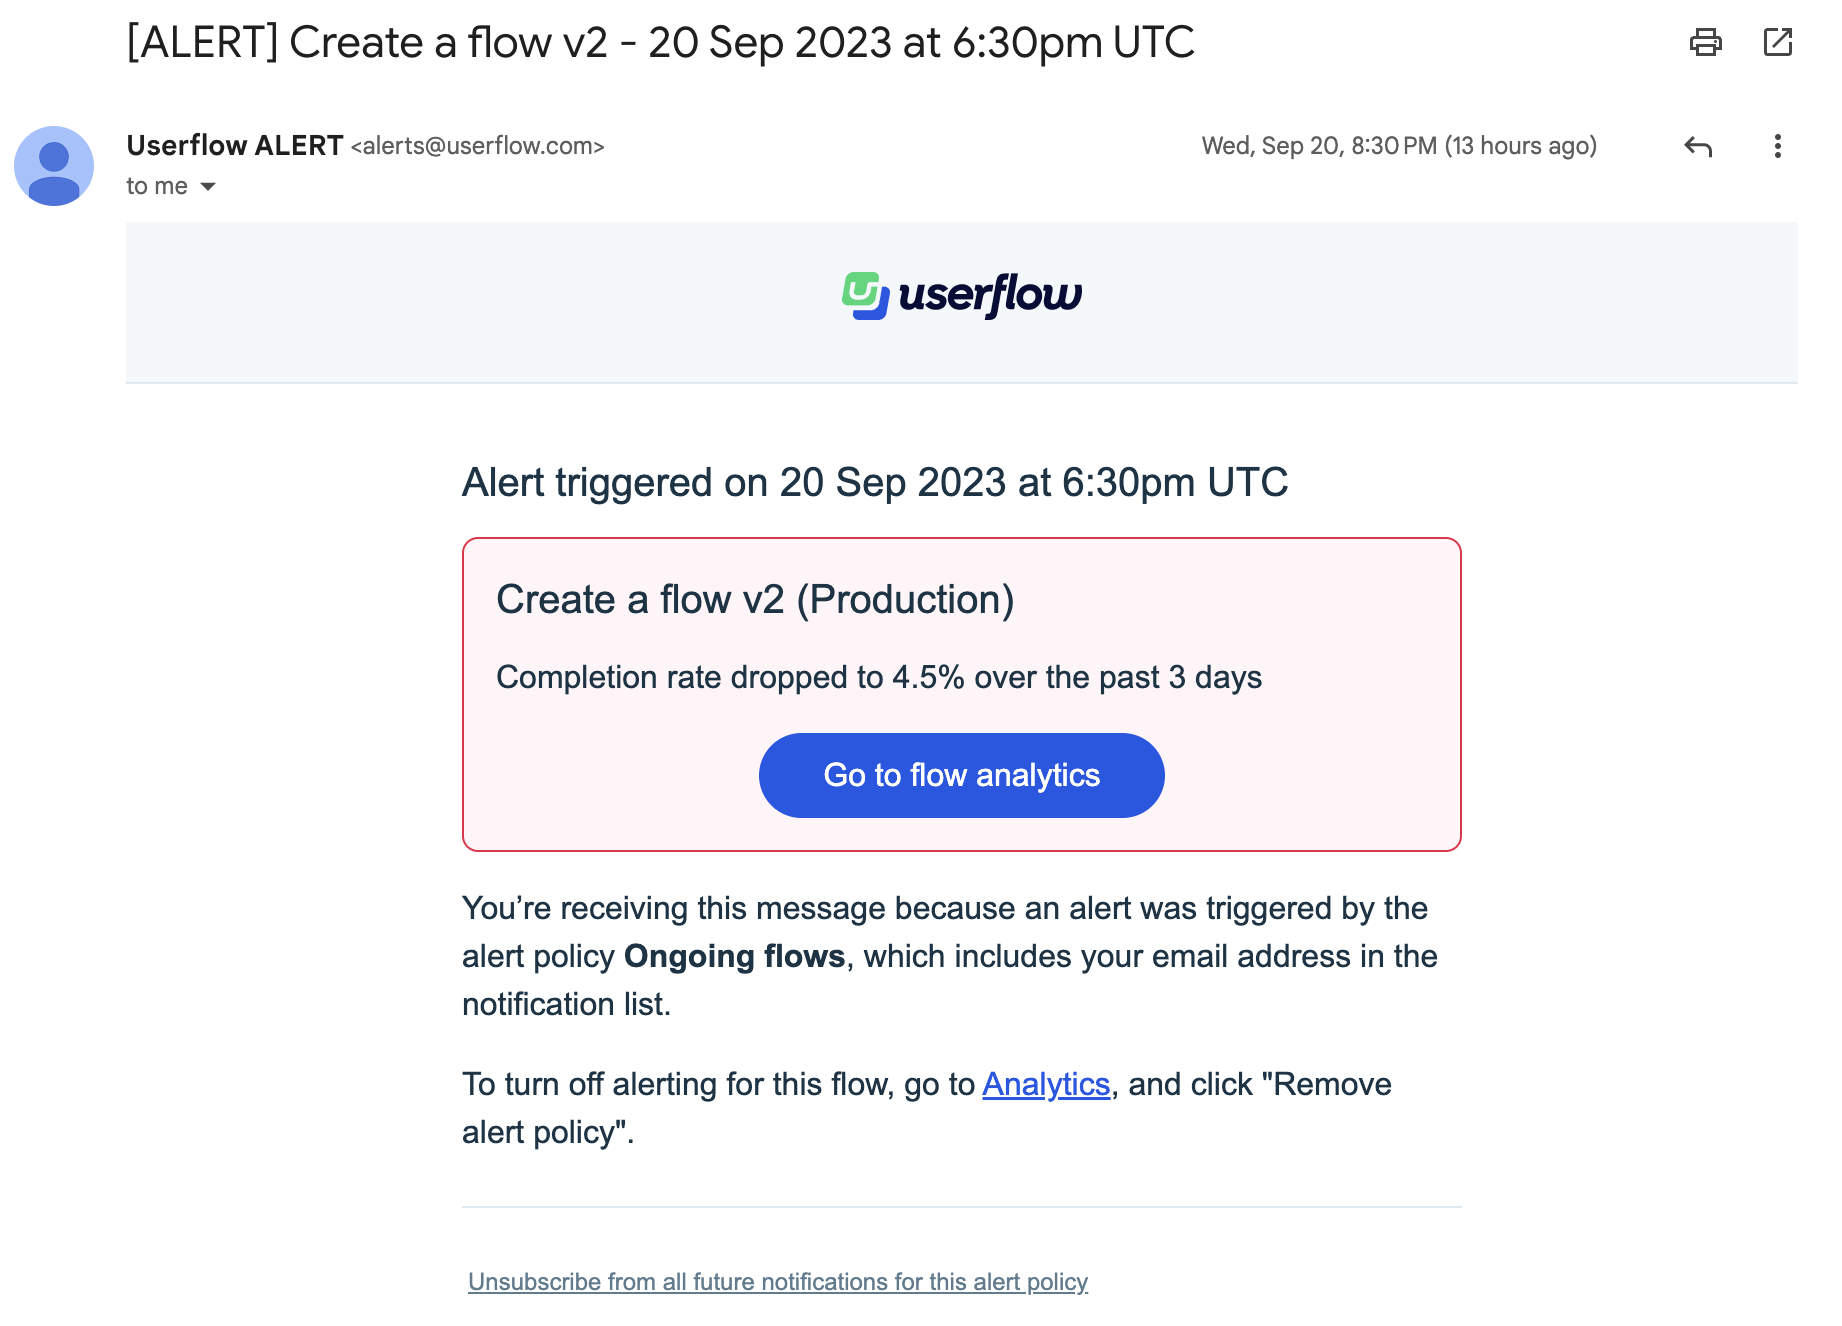
An alert remains active until the concerning metric meets or surpasses the threshold. Once resolved, another email notification is sent.
The Userflow UI displays active alerts in 3 places:
The Content list highlights items with ongoing alerts via a red bell icon.
The Builder page displays a red bar at the top.
Similarly, the Analytics page showcases a red alert bar.
Muting alerts
After addressing the underlying issue of an alert, you can choose to mute it for a specific period, like a day.
Just select Mute alerts from the three-dot menu on the Analytics page.
Muted alerts are auto-resolved silently, meaning no email notifications are sent. Alert checks remain paused during the mute period and resume afterwards. A fresh alert only triggers after the mute period if the metric is still below the defined threshold.
When you mute alerts, the active alert will be silently be resolved (i.e. no notification email is sent), and the alert check won’t run for the mute period you select. Once the mute period ends, the content item will be checked again. Only if the monitored metric’s threshold is failed to be met, another alert will be triggered.