Available for all paid plans.
The Beamer Dashboard is your centralized, real-time command center for managing all product communications, feedback, and user engagement metrics in a single, unified interface. This powerful tool helps product teams track performance metrics, analyze user sentiment, and make data-driven decisions without switching between multiple platforms.
AI Insights for NPS and AI Insights for Feedback automatically transform unstructured customer feedback into clear, actionable themes.
AI Insights for NPS instantly surfaces what drives sentiment across Promoters, Neutrals, and Detractors—eliminating hours of manual analysis.
AI Insights for Feedback automatically clusters similar feedback submissions to reveal patterns and priorities, helping you spot trends and filter out noise. These intelligent features turn what was once overwhelming volumes of raw feedback into strategic insights you can act on immediately.
The Beamer Dashboard brings together your changelog, NPS, and feedback data in a single view, giving you comprehensive visibility into how users interact with your product communications.
Beta Notice
AI Insights for NPS is currently in Open Beta for customers on the NPS Pro plan and above.
AI Insights for Feedbak is currently in Open Beta for customers in the Feedback Pro plan.
Key benefits
Actionable insights at a glance: Transform scattered data into clear business decisions with our unified dashboard that reveals patterns across Changelog, Feedback, and NPS metrics in under 60 seconds.
From hours to minutes: Eliminate repetitive report creation with our streamlined dashboard that lets you instantly filter and segment performance data by product, content type, or time period—all from a single dashboard.
Seamless exploration: Navigate your data landscape with purpose. One click directly takes you from high-level dashboard insights to the content that matters most to your decision-making.
Top-level metrics
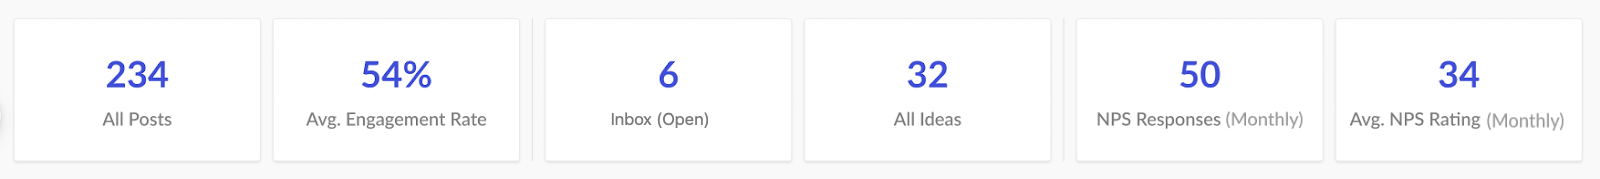
The Top-level metrics provide a view of your overall product communication effectiveness across all channels. Select a specific metric to view its details and gain actionable insights.
Metric | Description | Update Frequency |
|---|---|---|
All Posts | Total number of posts associated with the product. | Real-time, when new posts are added |
Average Engagement Rate |
| Real-time based on user interactions |
Inbox (Unread) | Total count of unread or open messages in the inbox. | As soon as new messages arrive or are marked read |
All Ideas | Total count of all ideas associated with the account. | Real-time as ideas are submitted or resolved |
NPS Responses (Monthly) | Number of NPS responses captured every month. | Real-time as responses are received |
Average NPS Rating (Monthly) | Average NPS rating for the current month. | Real-time as responses are received |
Viewing and navigating data
The tabs beneath the primary metrics modify the chart data displayed for Changelog, Feedback, and NPS. Select each tab to see its corresponding chart data and insights.
Changelog
Monitor unique views and engagement rate for all Changelog posts, analyze performance metrics, and user engagement.
Engagement Metrics
Hover your mouse over the graph to view a summary of specific metrics for that timeframe, and choose the Day/Week/Month options or adjust the date range using the drop-down menu of preset date ranges. (Defaults to the last 7 days.)
.png)
Latest Post Metrics
The latest post section showcases your most recent Changelog post, along with the three most recent comments. Below the post content, you'll find comprehensive performance metrics, including views, unique views, clicks, comments, and ratings, that provide a snapshot of how your post is performing. Each of these metrics is clickable, allowing you to dive deeper into the underlying activity and data.
.png)
Top Performance and Lowest Performance Metrics
You can quickly assess content performance by comparing each post's unique views and engagement rate, with posts automatically organized into top-performing and lowest-performing groups for easier analysis. To explore deeper insights, click any post title to access comprehensive analytics and detailed metrics for that specific post. All performance metrics refresh automatically as new data becomes available, ensuring you always see the most up-to-date view of how your posts perform over time.
.png)
Feedback
Transform customer feedback from an overwhelming stream into strategic product decisions with Beamer’s Feedback platform. Whether you’re tracking individual submissions or analyzing patterns across hundreds of responses, these features help you understand what your customers truly need. View new ideas and comments as they arrive, dive into detailed feedback entries, or let AI Insights for Feedback automatically organize your feedback into actionable themes, complete with revenue potential estimates and trend analysis. From quick daily reviews to comprehensive roadmap planning, you’ll have the clarity to prioritize what matters most to your customers and your business.
AI Insights for Feedback
Open beta available to customers on the Feedback Pro plan. AI Insights summaries are only available for accounts that meet the minimum Feedback volume requirements.
AI Insights for Feedback automatically organizes and analyzes your Beamer feedback, transforming unstructured customer input into actionable insights. Instead of manually reviewing hundreds of individual feedback submissions, our AI uses intelligent clustering to group similar feedback into themes, filter out spam, and highlight emerging trends. You can quickly identify what matters most to your customers, track how feedback themes evolve over time, understand revenue potential, and maintain a clean feedback pipeline as completed items are automatically archived - turning what was once an overwhelming stream of data into clear, prioritized insights that drive better product decisions.
Privacy assurance
To protect your users’ privacy, we only send the essential text needed for AI processing. Personal or identifiable end-user data is excluded from the request. No data sent to the LLM is stored or used to train external models.
Accessing AI Insights for Feedback
Select the Feedback tab in the Beamer dashboard to view Feedback insight summaries.
The dashboard displays the top themes from your feedback, the percentage of feedback and the number of customers each represents, and the estimated revenue that could be achieved by addressing the feedback. Hover over the information icon to see more details..png)
Click a Feedback summary to view its details.
.png)
Viewing Feedback details
Once you’ve opened the details of a Feedback theme, you can analyze and manage the feedback:
Change the visibility of specific feedback by clicking the visibility icon (the eye) for an individual entry, or select multiple checkboxes and change the visibility from the Actions menu header that appears.
.png)
View vote and comment details by clicking the corresponding number for the feedback.
.png)
View Feedback details, including the Feedback score, number of votes received, estimated revenue, and effort for each entry.
.png)
Link (for public feedback only), merge, edit, archive, or delete feedback using the menu to the right of the feedback entry or the Actions header options for multiple feedback entries.
.png)
New Ideas and New Comments
Available for customers on the Beamer Pro plan.
View the number of new ideas and comments for the last 7 days at a glance. The count will change in real time as you receive new submissions. Click the count to view the new ideas or new comments for deeper insights. The latest five ideas provide insight into the number of comments and votes, along with associated categories and visibility. Click an idea to view its details.
.png)
Roadmap
The Roadmap provides a comprehensive view of your submitted ideas, organized by assigned status. By default, both private (internal) and external (public) ideas are displayed together, though you can easily filter the list using the Visibility drop-down menu to focus on specific types. Navigate the complete list by scrolling to see ideas that extend beyond the visible page area, and click any idea title to view its full details. Each feedback entry is clickable for more details.
.png)
NPS
View Net Promoter Score (NPS) responses collected over time with average NPS ratings for the current period, and analyze how users respond to the product. Get automatically-generated summaries for each cohort that give you insight into your users’ responses and how they feel about your product. Click the chart elements for NPS response data, monthly ratings, and breakdowns of respondent types. (e.g., promoters, passives, and detractors).
Key NPS use cases
The NPS dashboard data provides insights to help you monitor customer sentiment and anticipate potential pitfalls. Use this data for:
Performance Monitoring: Track daily or weekly NPS fluctuations to identify sudden drops that might indicate service issues, product bugs, or negative customer experiences requiring immediate attention.
Campaign Impact Assessment: Measure how product launches, feature releases, or marketing campaigns affect customer sentiment by comparing NPS scores before, during, and after these initiatives.
Seasonal Pattern Recognition: Analyze more extended time periods to uncover recurring patterns, such as lower scores during high-volume periods or improvements following regular product update cycles.
Team Performance Correlation: Align NPS trends with internal changes like new support processes, team training, or staffing adjustments to understand their impact on customer satisfaction.
Benchmarking and Goal Tracking: Use a period-over-period comparison to evaluate whether you're meeting quarterly NPS targets and whether you're trending in the right direction toward annual goals.
Early Warning System: Spot gradual declines in average NPS that might not be noticeable day-to-day but become clear when viewing weekly or monthly trends, allowing proactive intervention before issues escalate.
Stakeholder Reporting: Generate quick snapshots for different audiences—last 7 days for operational reviews, monthly views for leadership updates, and quarterly trends for board presentations.
AI Insights for NPS
Open beta available to customers on the NPS Pro plan or higher. AI Insights summaries are only available for accounts that meet the minimum NPS volume requirements.
Transform raw NPS feedback into actionable intelligence instantly with AI Insights for NPS. Instead of spending hours copying responses into spreadsheets or internal AI tools for analysis, you get automated summaries and clear themes that reveal what Promoters, Neutrals, and Detractors care about most. This feature eliminates error-prone manual workflows and fragmented tools, delivering organized insights directly in Beamer so you can focus on improvements that matter to your customers.
Privacy assurance
To protect your users’ privacy, we only send the essential text needed for AI processing. Personal or identifiable end-user data is excluded from the request. No data sent to the LLM is stored or used to train external models.
Accessing AI Insights for NPS
Select the NPS tab in the Beamer dashboard to view NPS insight summaries. We analyze approximately 3-6 months of your recent NPS responses to generate these insights, adjusting the timeframe based on response volume.
.png)
Click a specific theme in the header to view its associated NPS responses. Associated comments will be listed below. Click Clear all to remove applied filters.
.png)
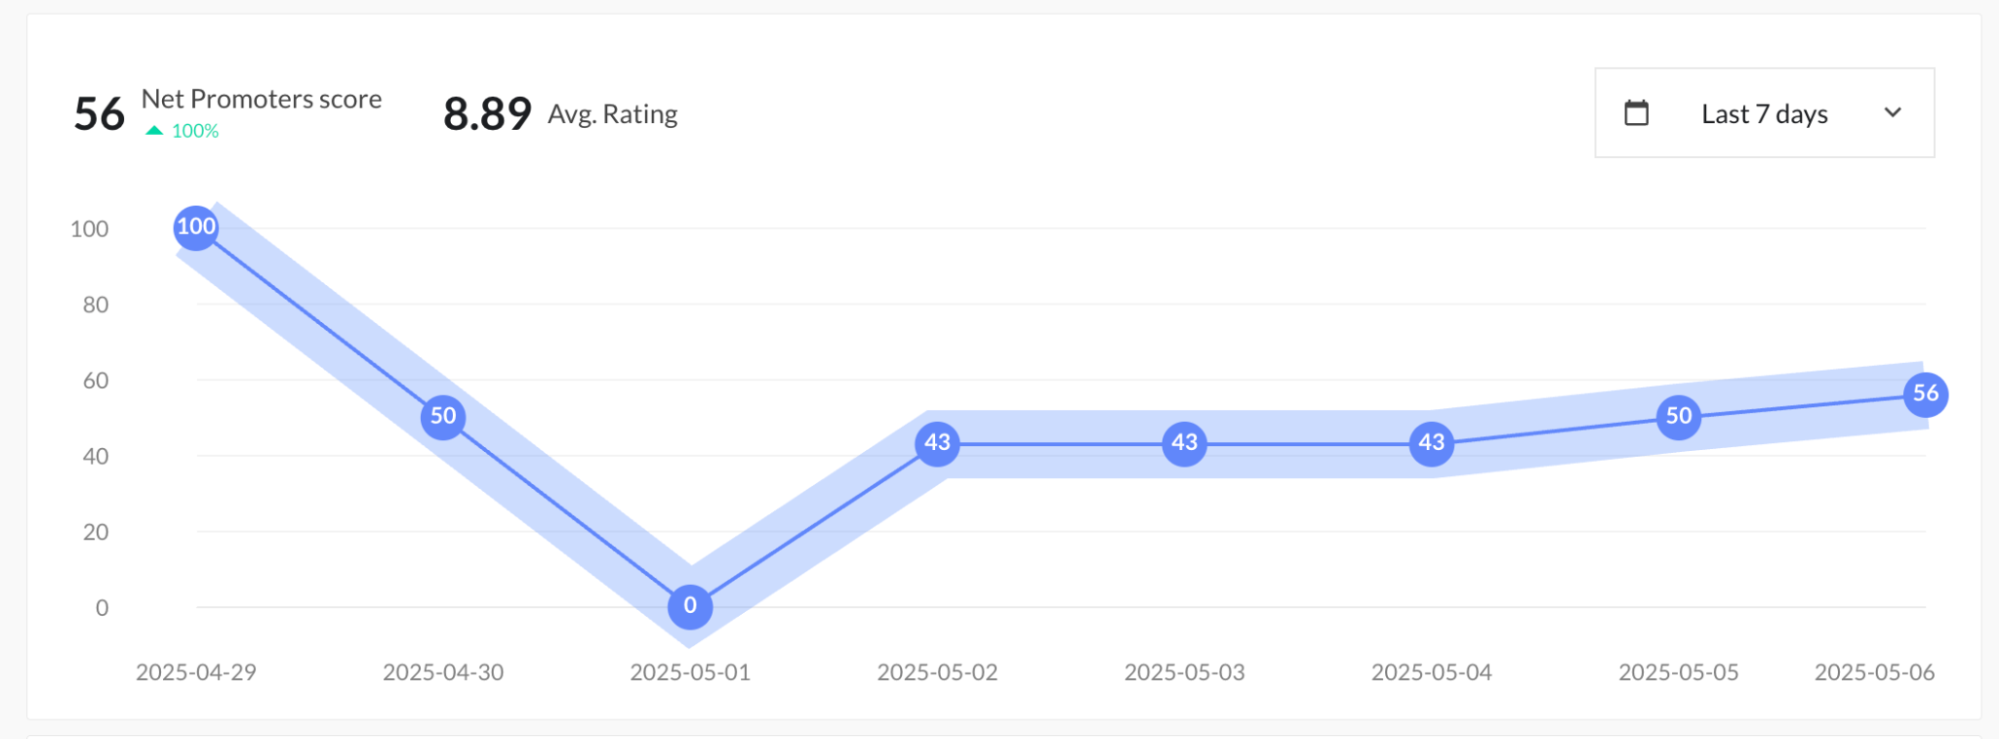
Net Promoter Score graph
The graph visualizes your NPS trends across intervals within the selected time period, with the default set to the last 7 days for immediate insight into recent performance. You can customize this data range using the drop-down menu to select from various predefined time periods that suit your analysis needs. Key metrics are displayed prominently, including your current NPS score, the percentage change from the previous period, and the average NPS rating for your selected timeframe, giving you a comprehensive snapshot of customer sentiment at a glance.
NPS Distribution
Use the distribution trend to analyze your NPS performance for the selected time period to identify upward or downward trends. If your scores are trending downward, it’s a signal that customer loyalty and satisfaction may be weakening. Identify and analyze root causes, and take targeted action to address sentiment.
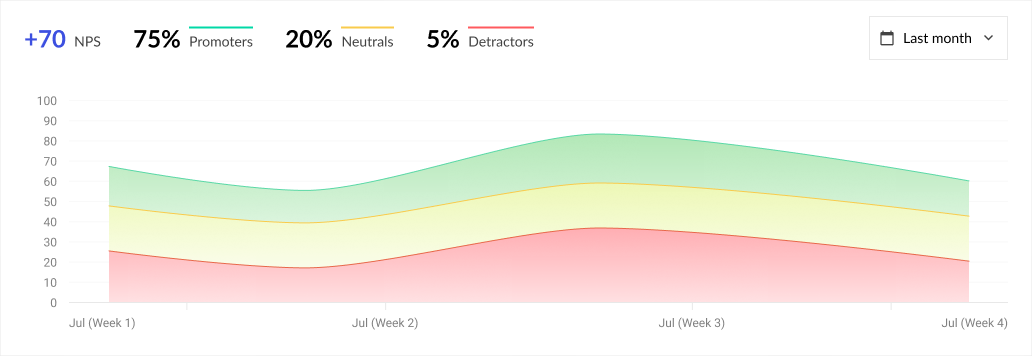
The graph’s time period defaults to Last 7 days. Use the drop-down menu to customize or select a predefined date range.
Hover your cursor over the graph to get a snapshot of specific metrics for that time period.
Latest Promoters and Detractors
View the most recent five NPS promoters and detractors' names, comments, and ratings.
.png)
This list will always be the most recent five entries, regardless of time period selections on other graphs.