Viewing Analytics
To view your analytics, select Analytics from the sidebar.
 {{ glossary.Beamer}} Advanced Analytics" width="auto" height="auto" dataalign="left" datadisplay="flex" data-type="media-content" fixaspectratio="false" autoaspectratio="false" shadow="no" border="yes" round="yes" link="" newtab="" style="width:auto;height:auto;">
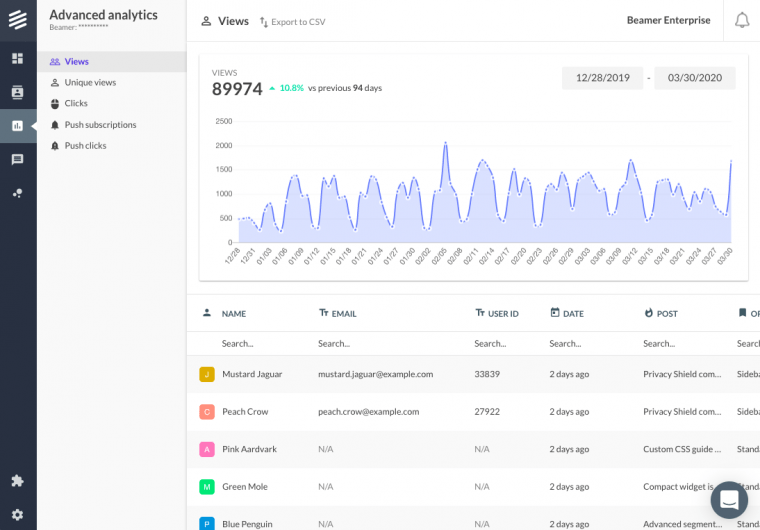
From Analytics, you can:
View graphs and user lists with all interactions sorted in the following types: ‘total views’, ‘unique views’, ‘clicks’, ‘push subscriptions‘ and ‘push clicks‘.
Filter the users by period by clicking on the dates on the top right of the graph.
Sort the users by any parameter by clicking on the respective parameter heading in the table.
Search specific data by using the individual search bars under each of the parameter’s headings.
Search Analytics
The analytics search functionality enables you to quickly filter and focus on specific data that matters to your analysis. Rather than scrolling through large datasets, you can use targeted search criteria to find exactly what you need. This focused approach not only saves time but also helps you uncover actionable insights and trends within specific segments of data most relevant to your goals.
How to search
Select an option from the search drop-down menu on the left.
Select a date range in the upper right and click Apply.
Enter search criteria in the search box or select an option from the search box drop-down menu.
Search options
The search options available in the drop-down menu are determined by the user attributes you pass. Some fields will require that you type search criteria in the search box (e.g., Name, Email, User ID, etc.) and others will present a drop-down menu to select from in the search box. (e.g., Origin).
.png)
What type of interactions are tracked?
Total views refer to the total number of times each post has been viewed by a user within the selected time period.
Unique views count the number of distinct posts each user has seen. One unique view is counted for every distinct user who sees a post (if the same user views the same post multiple times, this still counts as only one unique view).
Clicks are the number of clicks you received on any link in your post during the selected time period (not just the call to action link, but any other included in your post).
Push subscriptions refer to the number of users or visitors who have subscribed to your push notifications.
Push clicks refer to the number of users or visitors who click on one of your push notifications within the selected time period.
Which parameters are tracked?
Note
To maintain transparency and adhere to legal requirements in specific jurisdictions, it is vital to notify your users about the monitoring of their data. Specify the exact data being collected and the reasons for its collection.
Parameters tracked with the Beamer Embed Code.
These are optional parameters that you can include in your Beamer Embed Code, such as name, email, and user ID, to see which specific users have viewed or clicked your posts or push notifications. ID and email won’t appear if you aren’t tracking these parameters, and an automatically generated alias will be included instead of a name. If you are using filters to segment your users, those will also be registered as parameters.
Scale users can add custom tracking parameters to their Embed Code and use them for Advanced Segmentation.
name (or an automatically generated alias if name is not tracked)
email (optional)
user ID (optional, unique identification number)
filters (optional)
Parameters tracked by IP.
Geographical information, such as city and country, is tracked by IP address (as closely as possible). Remember that users can use VPNs or other methods to hide their geographical information.
city
country
Parameters tracked by request.
Other data is extracted by requests. This information is tracked automatically and may help you identify and segment your users even if you aren’t tracking any individual information.
date (the time when the interaction happened)
post (the specific post where the interaction happened)
origin (the type of Beamer feed where the interaction occurred)
ref url (the URL where the Beamer feed was embedded)
browser
os (operating system, as Windows or Mac)
language
What about User Segmentation?
Users who interact with your content will be tracked in your Analytics and can also be segmented. This feature is included only in our Scale plan.
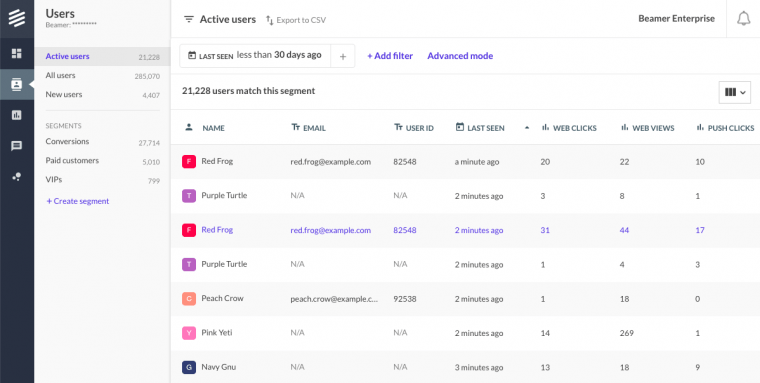
Select Users in the sidebar to view a list of all your users. From there, you can:
Sort them using the filters at the top of the screen and create segments. For more information on Advanced User Segmentation, please read the Advanced Segmentation guide.
Sort the users by clicking on the heading of each column of the table.
Toggle columns and pick what you want to see by clicking on the column icon at the top right of the table.
View detailed information on each user’s interactions by clicking on a user. That will display a window with their individual profile.
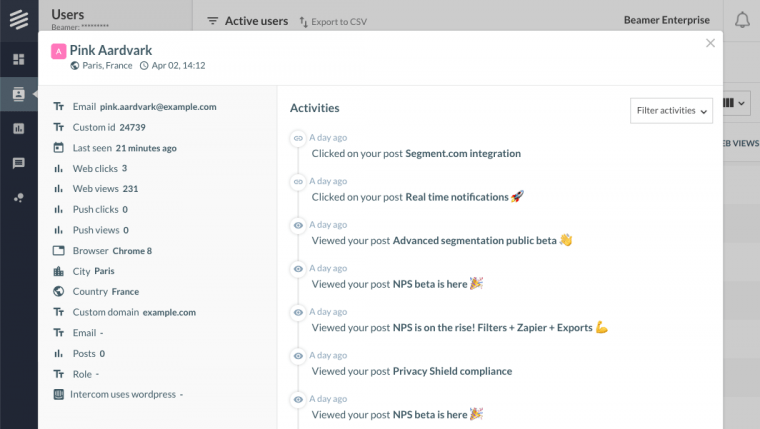
All your analytics will be available in your Users view. The table will display equivalents of the interaction types listed above.
Post views: the total number of times the user has opened your feed (according to the filters, if they apply).
Post clicks: the number of clicks the user has made on any link in your post, including but not limited to the call to action (according to the filters if they apply).
Push views: the number of times the user has seen a push notification you sent them.
Push clicks: the number of times the user has clicked on a push notification you sent them.
Advanced User Analytics provides numerous additional features that enable you to measure, track, and engage with user interactions. Learn more in our Advanced Segmentation guide.